The week of October 24 included several days of testing, something we do in October with our fifth and sixth graders. To learn more about that, read this separate blog entry.
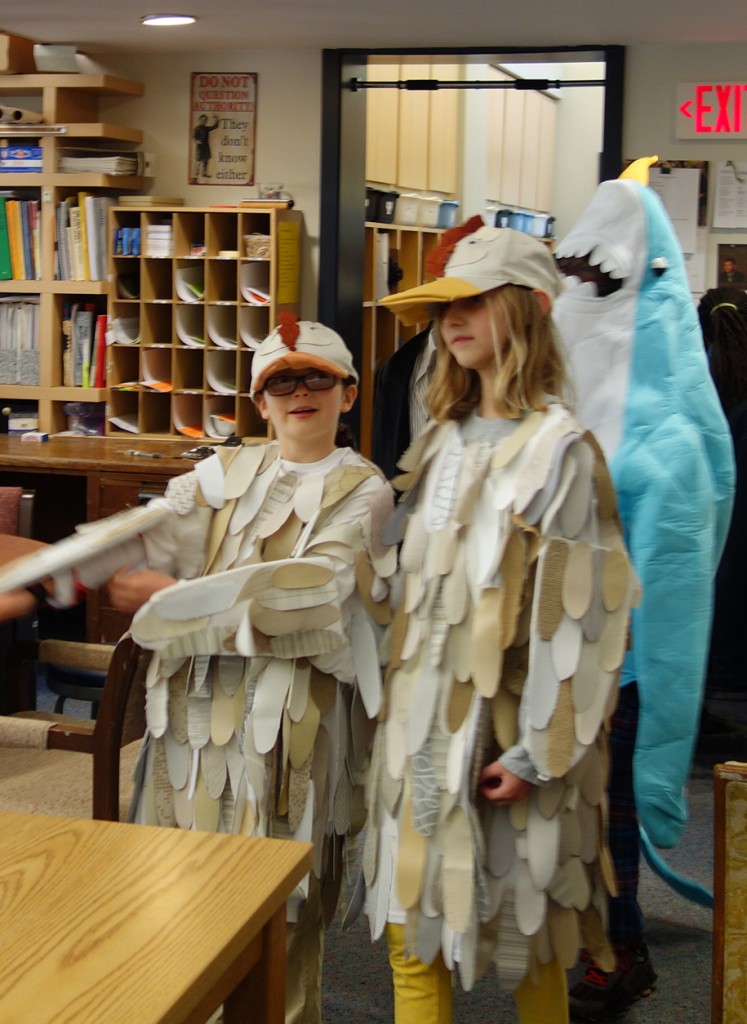
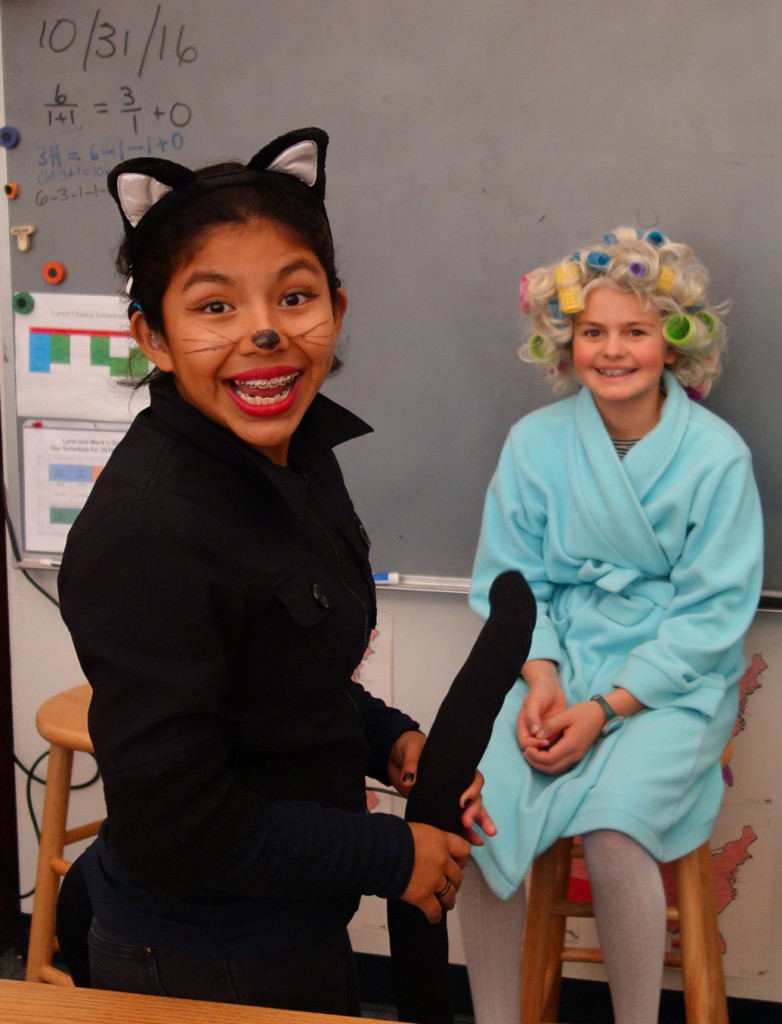
The second week started with Halloween, an ancient holiday celebrated at Miquon with a great deal of enthusiasm. We did a reading/writing activity that presented some of the European-based history of the holiday. Students worked in pairs to complete the pages and observed, when they finished, that they had learned a lot. A copy of it can be found here: Halloween history
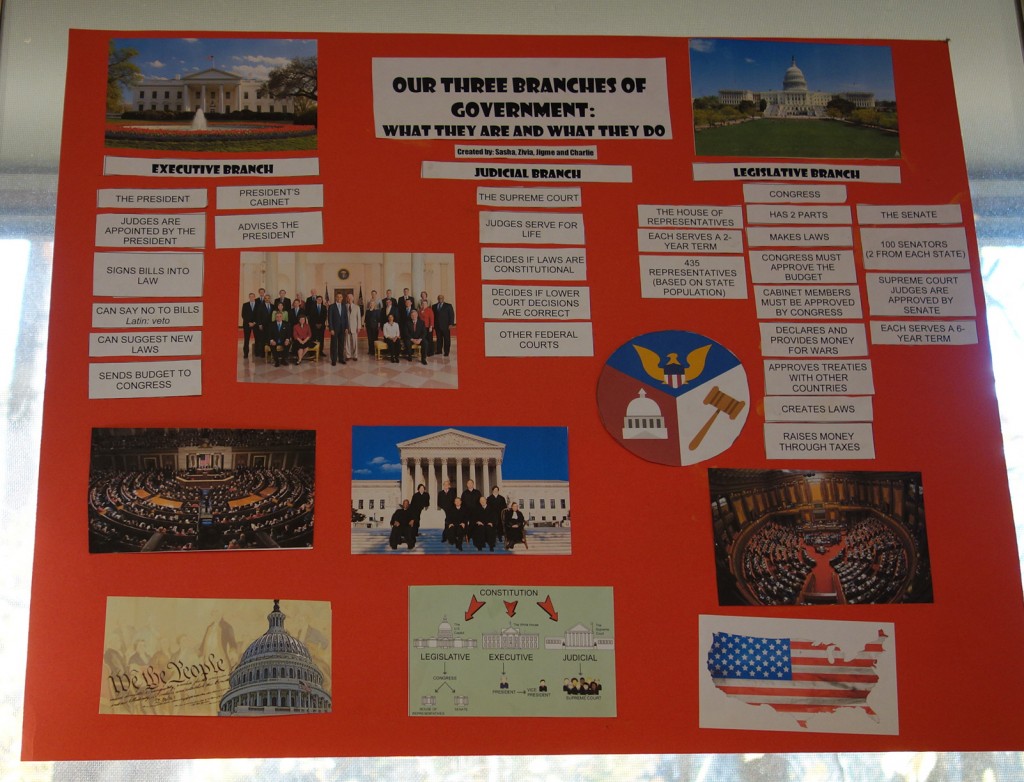
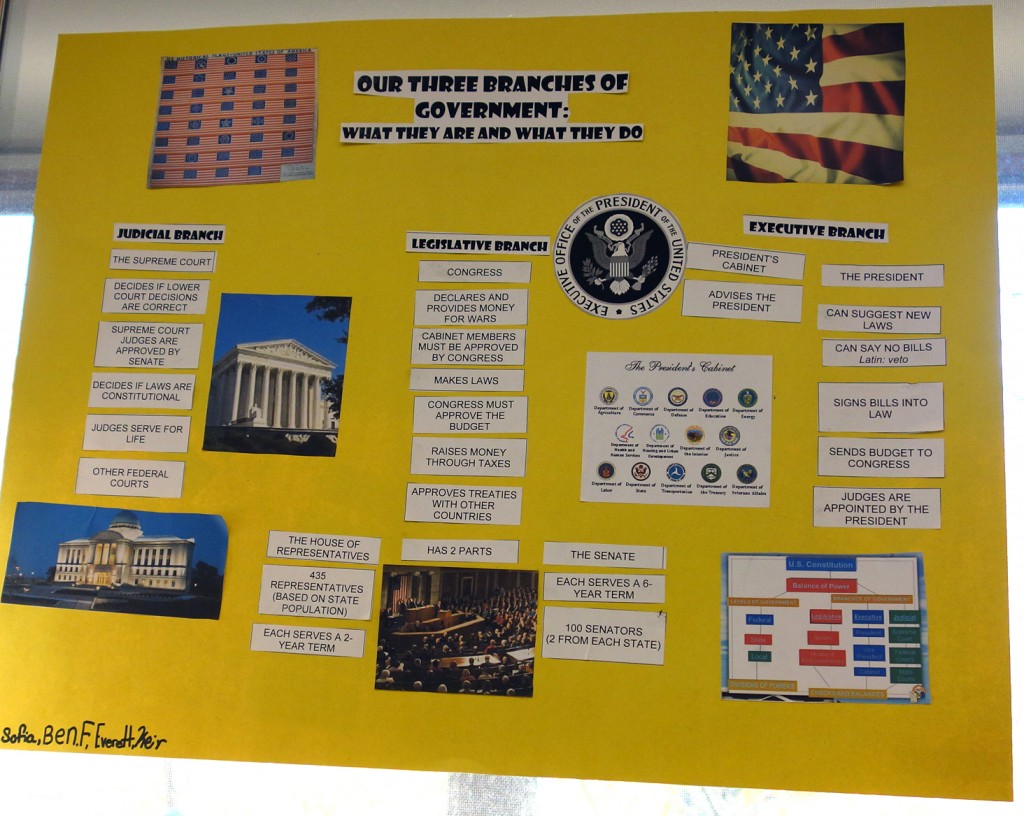
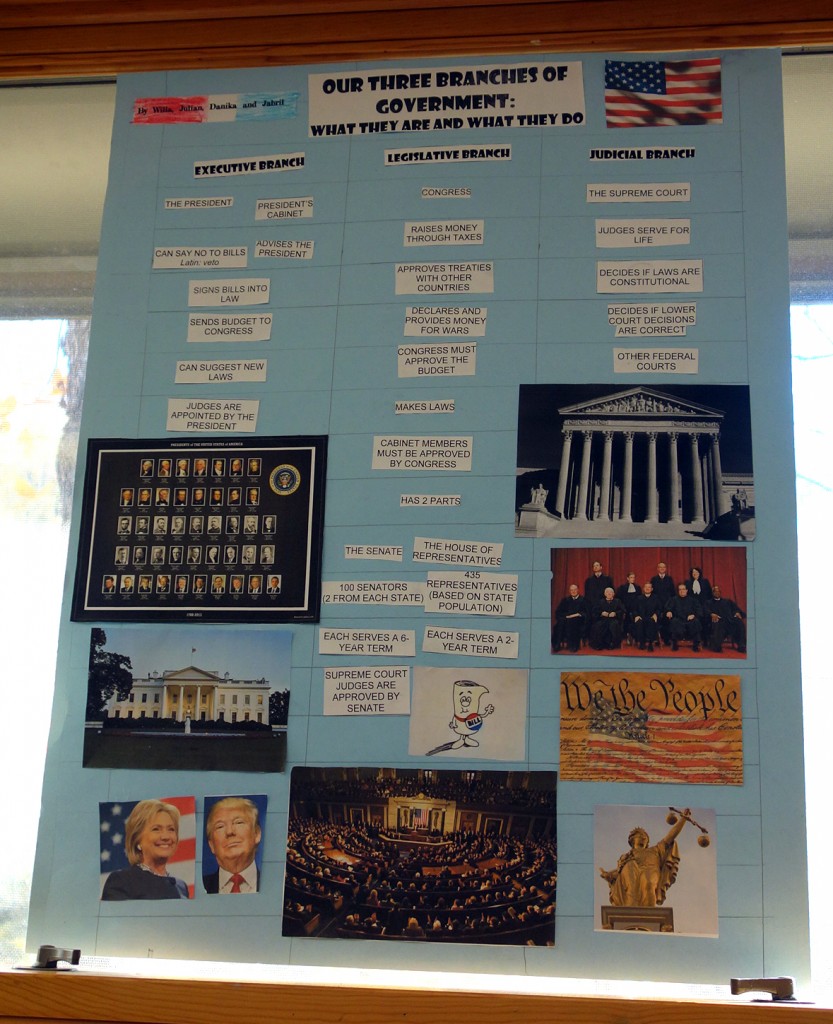
We (finally) finished those structure-of-government posters! See our previous blog post for a detailed description of what students did and what they were learning from it.
As the pre-election frenzy continues, we have done a lot of viewing of polls and forecasts. We’ve been given a lot of data — some as percentages, some as probabilities, some as interesting graphs. We’ve talked about surveys and what they may or may not predict accurately. We’ve checked in frequently with the “probability of being elected President” graph at the NY Times website.
On Friday, we looked at surveys for several states. (You’ll need to scroll down to find the state graphs we viewed at that site.) Students were a bit misled at first by the apparent gap between the two candidates. They thought it was larger than it is because the y-axis of the graph did not start at zero. This helped us to underscore the importance of looking at the structure and format of a graph in order to correctly interpret the visual presentation. They also noticed that the Clinton and Trump popularity lines crossed each other in some graphs, while others remained separate. We talked about what that meant and connected it to the reasons that the candidates were campaigning more in some states than in others.
Students had a lot of good questions, including what would happen if the two major candidates ended up with a tie. This is something worth discussing further at home. Students generally came to understand that the prospect of a tie made the down-ballot outcomes extremely important. From the work they had done on their posters, many knew that 1/3 of the Senate and all of the House of Representatives are part of the election decisions that voters must make. A tie would be resolved by the members of the new Congress, not the current one.
Students also saw and discussed this delightful, short video that tries to explain the electoral college.
After conference week, we’ll be getting our own election launched — the one to select the National Doughnut. We are considering extending it to the entire school this year, not doing in only with the 5th and 6th graders. At our monthly good-of-the-school assembly on Friday, students engaged in a lengthy discussion of the purpose, problems, and organization of the “monkeyland president” campaign that has been going on at choice time for a while. Stay tuned.
In connection with our ongoing study of migration, using our simulated wagon train journey as an example from history, students have been working in pairs to research and create a slide show on an aspect of the cultures of the Native Americans who were living on the plains and prairies as our settlers rolled through. Topics include food, religion, tools, weapons, homes, and more. Students will finish their slide shows and present their findings to the group during the week of November 14. One of the core questions of our full-year migration study asks how people are changed by the arrival of new groups into their territory. As we will see, Native Americans were deeply affected by the expansion of the United States in the 19th century. We will also be spending some time learning about a current event: the clash over the pipeline being built through the territory of the Standing Rock Sioux.

