
A part of our month-long exploration of measurement included “raising” Gro-Beasts. These are alligators made of a water-absorbing polymer. Students placed them in plastic shoeboxes filled with water and kept track of the changes in their mass, length, and girth. Sadly, this year’s product was somewhat defective and didn’t grow as much or as quickly as the ones we have bought in years past. (Correspondence with the apologetic manufacturer confirmed that observation, but we still were able to do the math activities that we had planned.)
Students set up a table with a place to enter data for every day from the beginning of the observations to the end. When they questioned the need for weekend days, we said they would need those spaces later. A digital scale let us find the mass, length was measured with a ruler, the girth behind the front legs needed a piece of string, and we also did a tracing of the outline at the beginning, about a week later (on the same graph paper), and at the end on a separate page..

When we decided that the gators had grown as much as they could, we started graphing our data. Students exhibited some uncertainty about setting up line graphs, so it was a good review for many and an introductory experience for a few. We discussed making a decision about the scale of the y-axis based on the range of the data. In class, we made graphs for length and mass. Making the graph for girth was a homework assignment, intended to provide us with a way to check their understanding of what we had taught. Although most came back with graphs that looked much as we had hoped, there were some wobbles that were easily resolved.
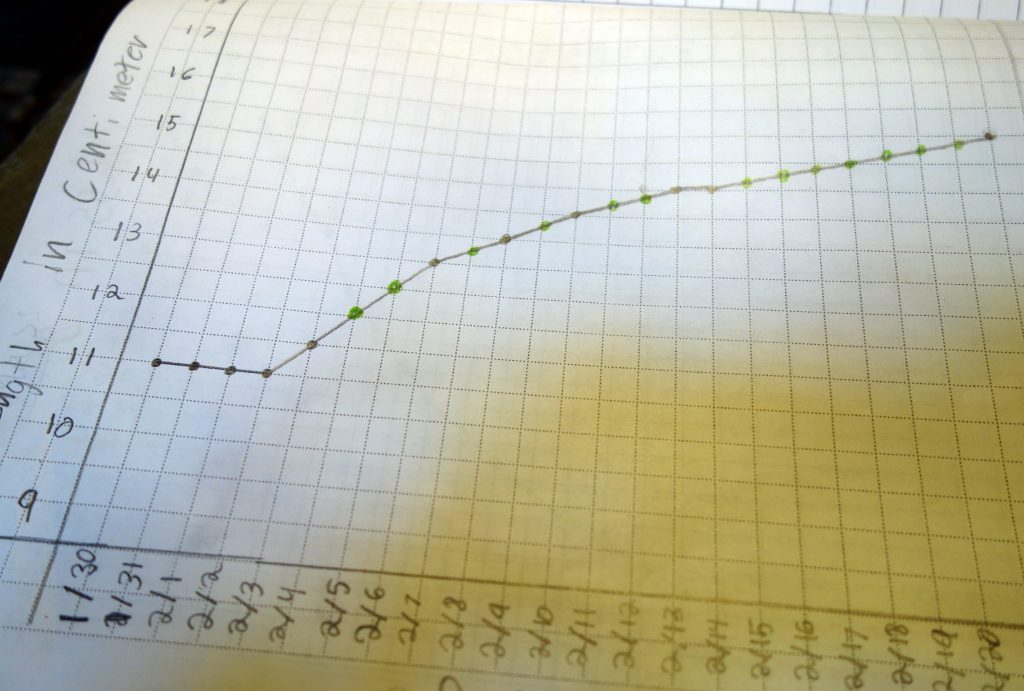
After our collected data was graphed, we discussed the idea of interpolation. Now that we had a path for the growth throughout the month, could we make some inferences about what the measurements would have been if we had been able to gather data every day? Students used a colored pencil to plot the intersections of the “empty” dates and the line of the graph. They then added that data to the table we had set up at the beginning. Those blank sections now had numbers, also recorded in colored pencil, and students understood why we had included those dates in the beginning.
The final challenge was that of finding the areas of the first and final tracings. Students were asked to make their best estimate for the large one that we made on the day we ended the project. Then we gave students a page with several polygons on it. They were able to find the areas of the rectangle and the triangles but were puzzled by the others. Some students had good ideas, such as partitioning the irregular polygons into ones they knew how to calculate, but it was harder than it looked.

At that point, we gave students a page that told them about Georg Pick, a mathematician who was born in 1859 in Vienna, Austria, and died around 1943 in the Theresienstadt concentration camp in Czechoslovakia. He was a friend and colleague of Albert Einstein when both were living in Prague (from 1911 through 1913). The friendship lasted until the start of WWII. Pick is thought to have collaborated with Einstein in some of his work. I explained that we were going to use a strategy known as Pick’s theorem to find the area of those troublesome polygons. (It’s important for students to remember that mathematics is a human construct, that there are people just like themselves behind every mathematical idea.)
The steps that Pick devised were these:
- After drawing the polygon on a grid, you count all of the places where the outline crosses an intersection of the grid. These are called boundary points.
- Then count all of the grid intersections inside the polygon. These are interior points.
- Divide the number of boundary points by 2. Subtract 1. Add the number of interior points.
You now have the area. (Try it on the rectangle above — you should come up with 16 boundary points and 8 interior points, giving an area of 15 square units.)
Students applied the formula to the irregular polygons and then wanted to see if the areas were correct. We brought up Geometer’s Sketchpad on our computers, opened up a sketch that had the same polygons on it, and used some of the software’s features to find the areas. The numbers matched!
Back to the alligator tracings . . . but they weren’t polygons. We agreed that Pick’s theorem should still give us an approximate area but not one that would be as exact as we would get from figures that had straight sides. After a bit of work with colored pencils and some tough decision-making about whether the outline was really on a particular intersection or not, everyone was able to come up with a number for the area that seemed reasonable to them.
Students enjoyed using Geometer’s Sketchpad and especially liked having some free play time at the end of a couple of our classes. Sixth graders knew some things about it from last year’s math activities and happily shared their knowledge of animation and color changes with their fifth grade classmates.
We ended all of this with a few days of working with coordinates on the full Cartesian plane. (And yes, we did mention Descartes.) We showed students a page with all four quadrants drawn on it but not numbered. We placed the positive numbers on the x and y axes and then asked students about how to label the rest of each axis. Several quickly suggested negative numbers, which was right. One student observed that the concept was a lot like what we had done earlier in the year with latitude and longitude. After completing the axis labeling and discussing how coordinates were written for plotted points, we gave students a handout that contained instructions that, if followed correctly, would emerge as a drawing. With a bit of error-correction, everyone ended up with the expected picture. We gave students a homework assignment: create a picture or design, write the coordinates and connection instructions for it on a different paper, and bring it to school to give to a classmate the next day. Although a few students ran into difficulty, most came up with a plan that worked. We finished with a dice game that required, again, the use of coordinates to place the game pieces.
Graphing, finding means and medians, applying coordinate geometry, practicing the application of a formula, using interpolation to complete a data set — there was a lot of solid mathematics in this part of our measurement unit.